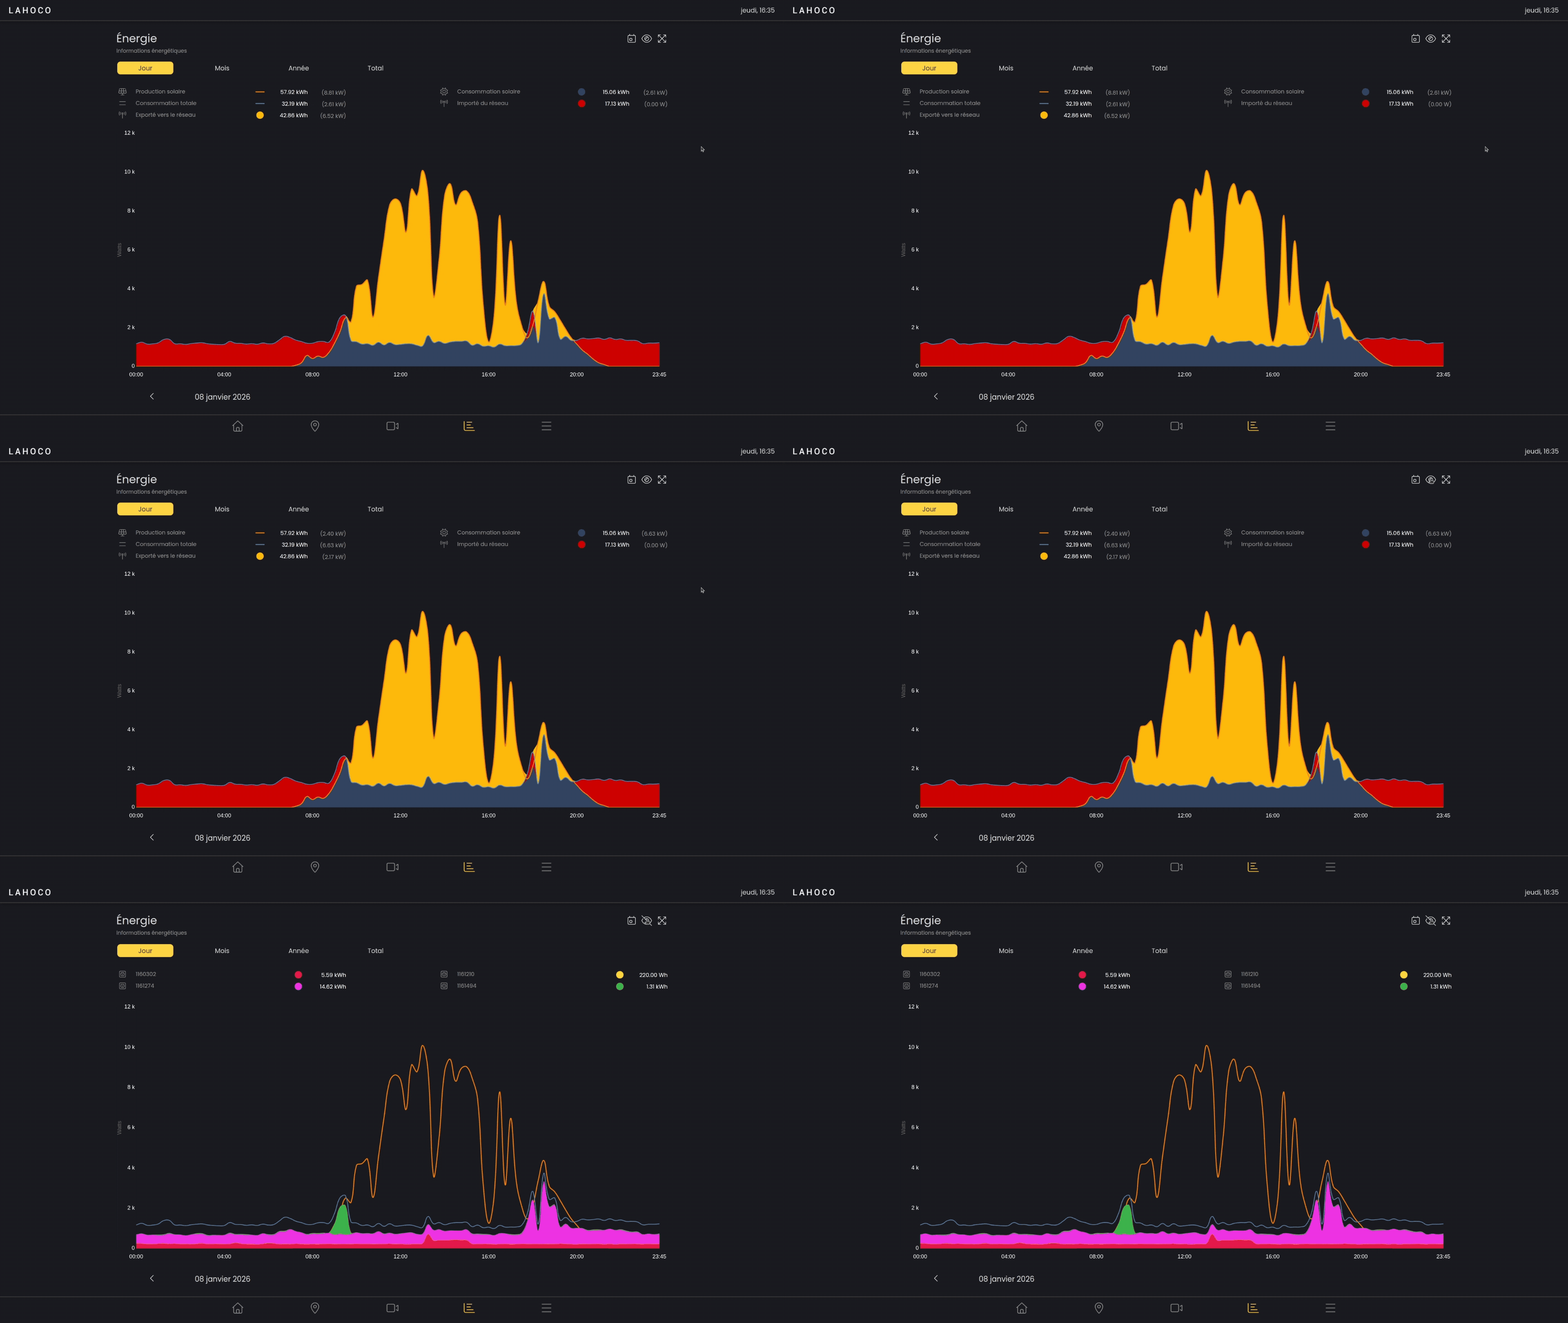
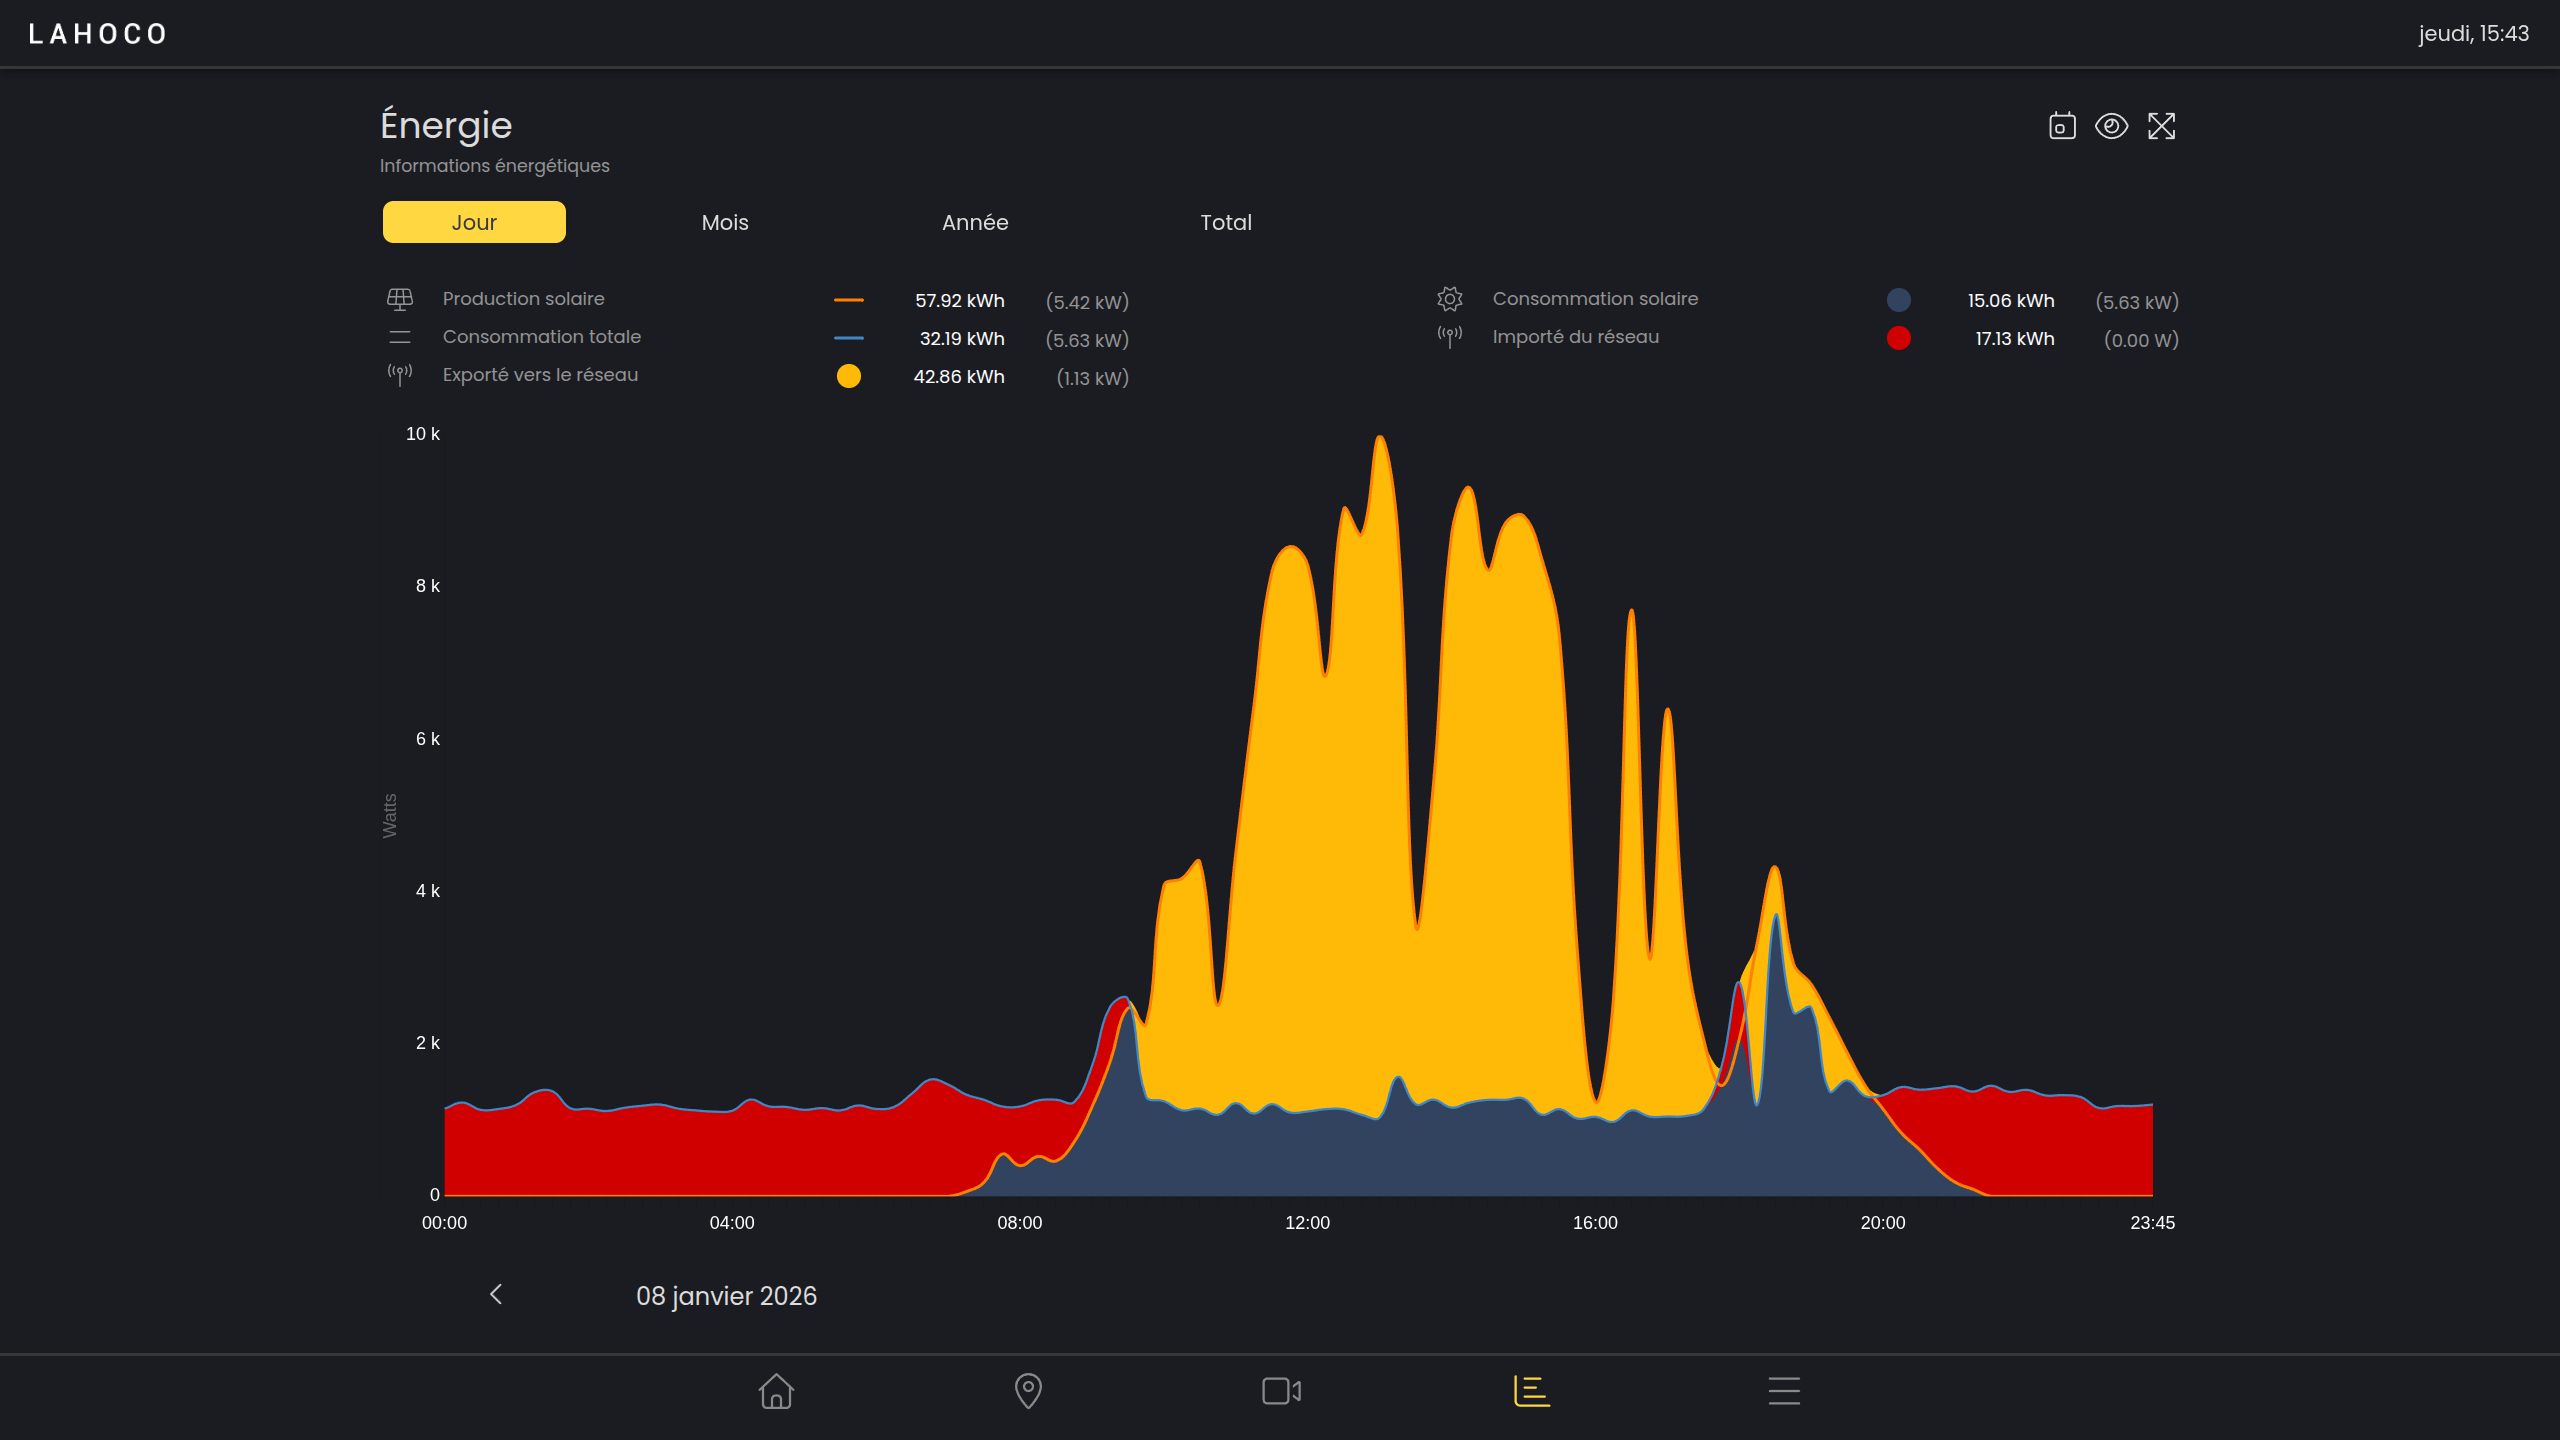
This page is accessible only to LAHOCO HOME installations with configured energy meters. It allows you to monitor your electricity consumption and production.
Charts
You can choose between 4 different charts:
-
Day
-
Month
-
Year
-
Total
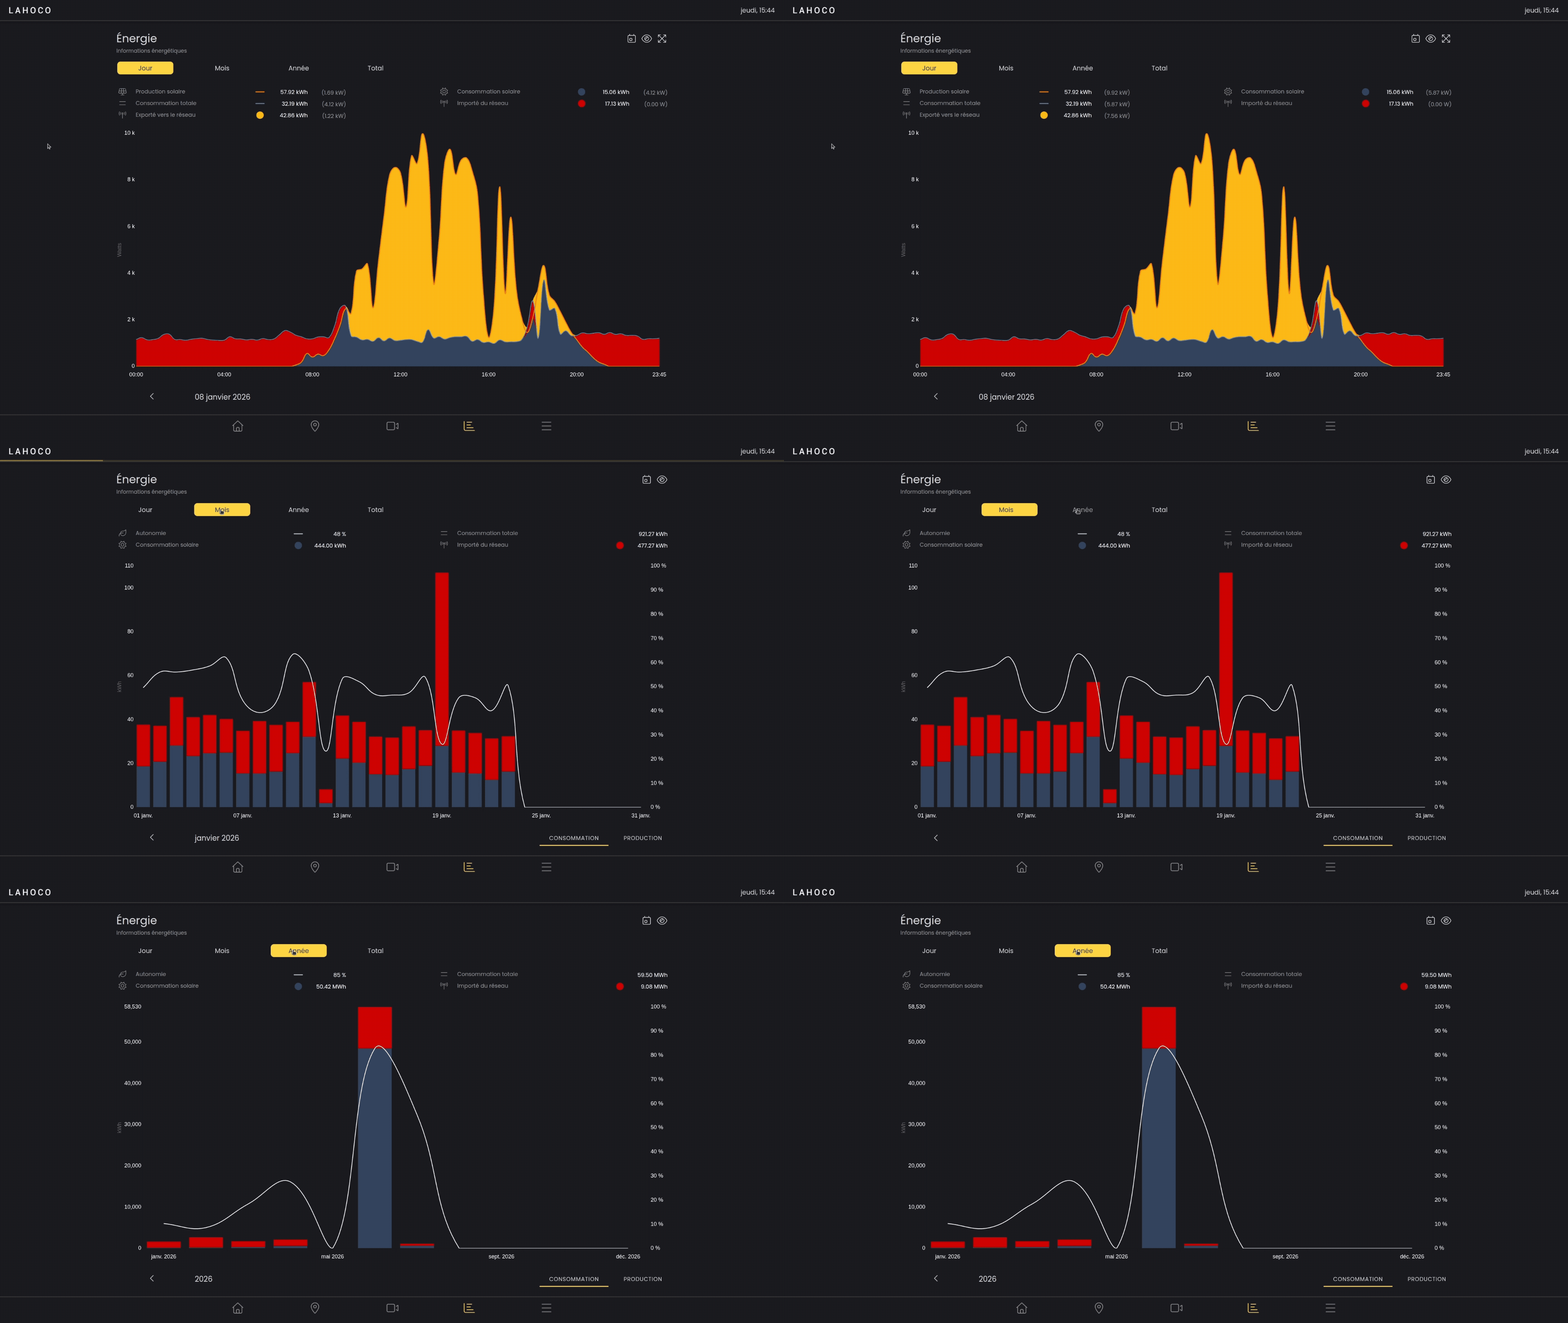
On the “Month”, “Year” and “Total” charts, you can change the type of chart displayed at the very bottom right. These two types are “Consumption” and “Production”.
Viewing a specific value over time
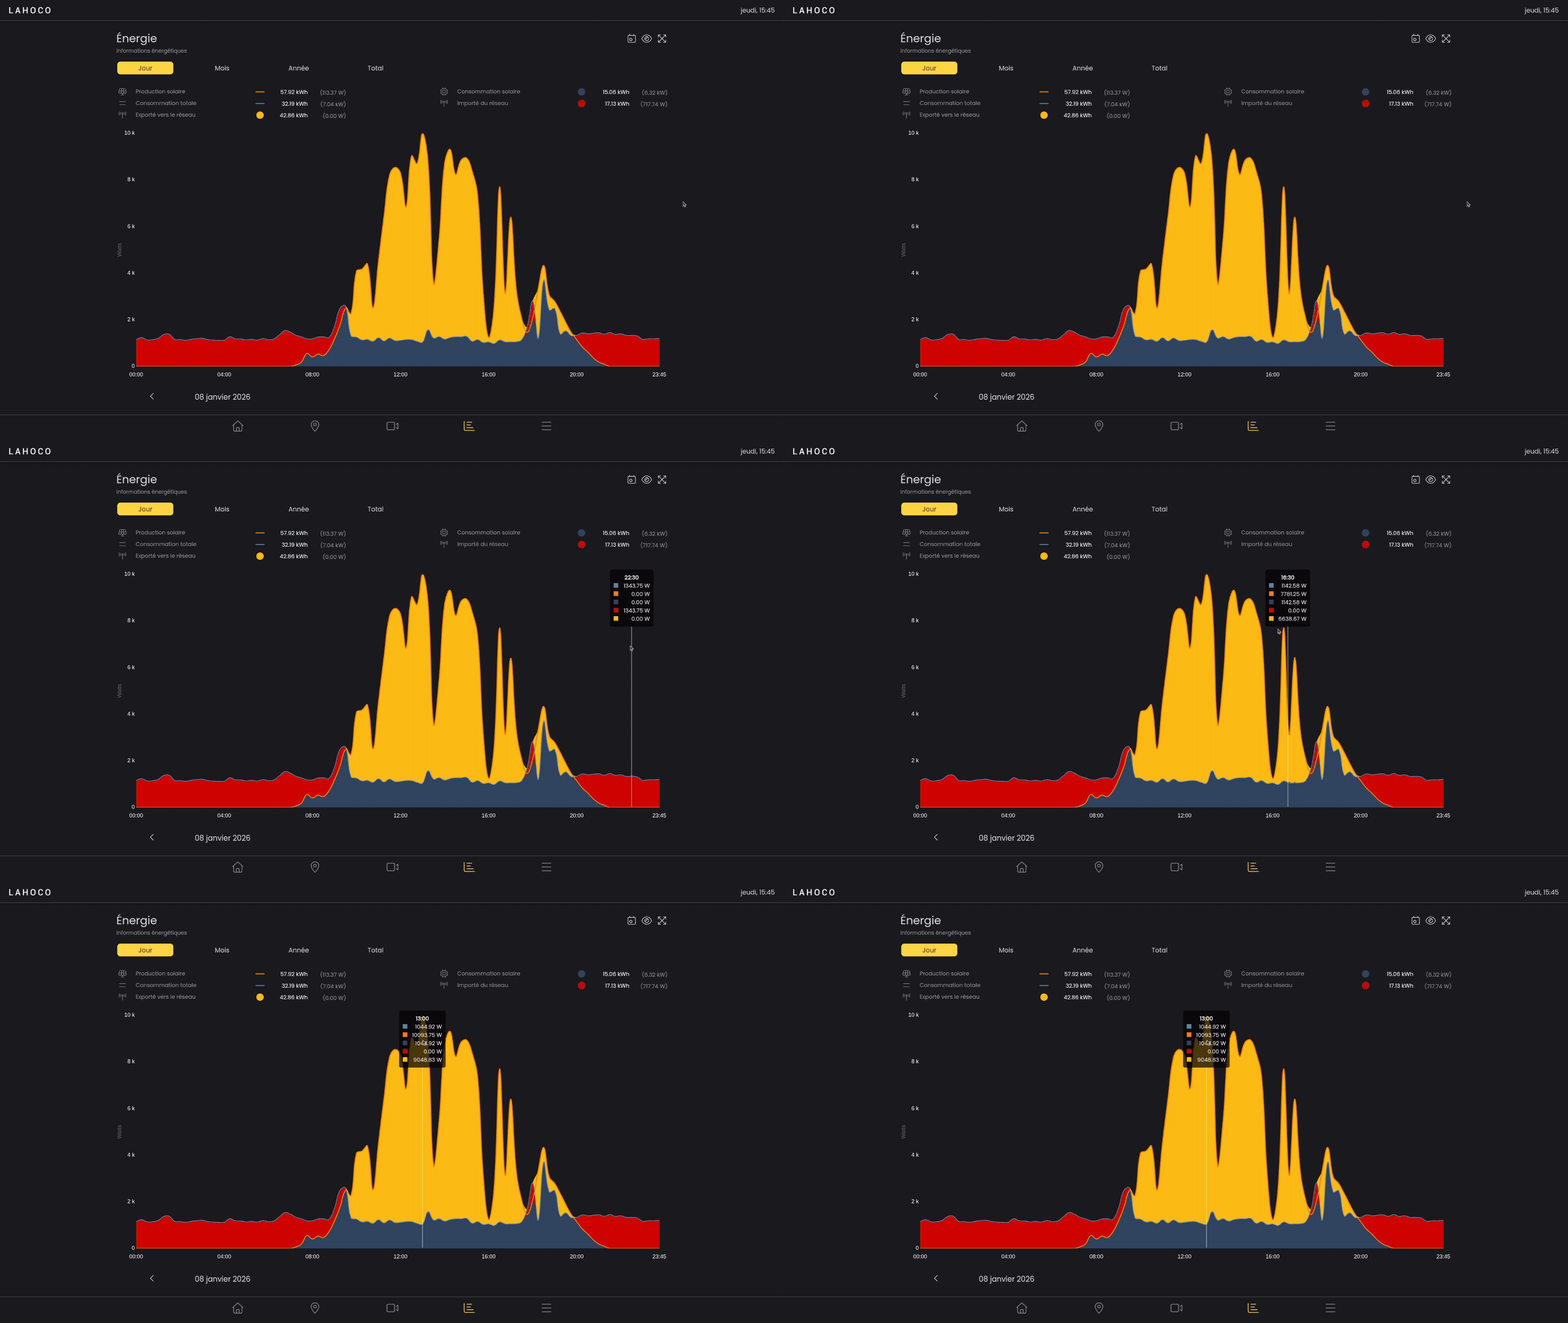
You can view a specific data point in time simply by hovering over the chart with your finger or mouse.
Legend / editing charts
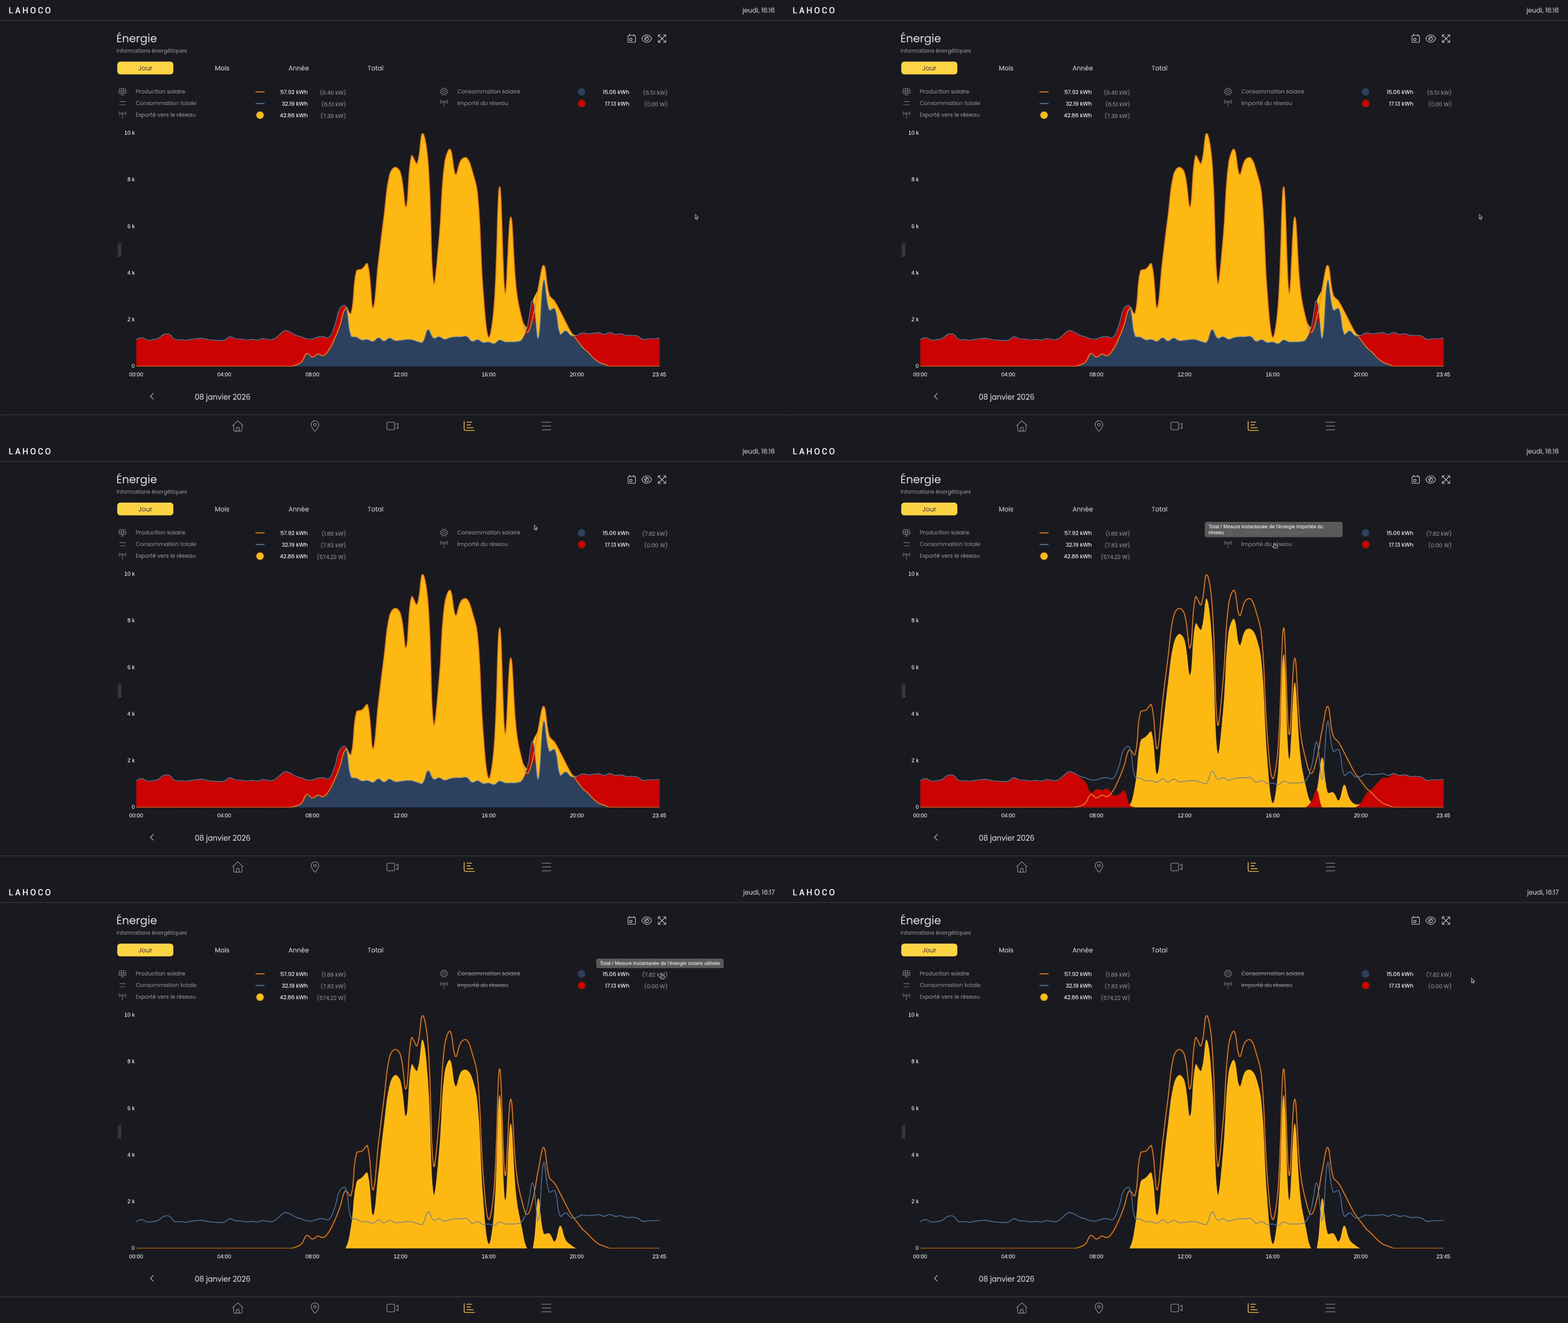
For each chart, you can show or hide elements of a chart by clicking on its legend.
Going back in time
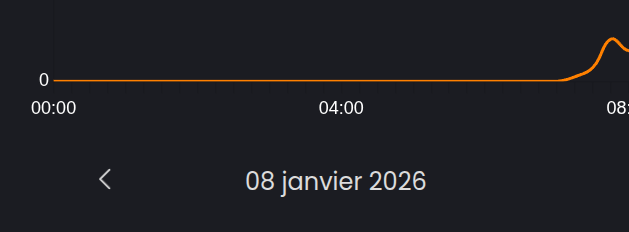
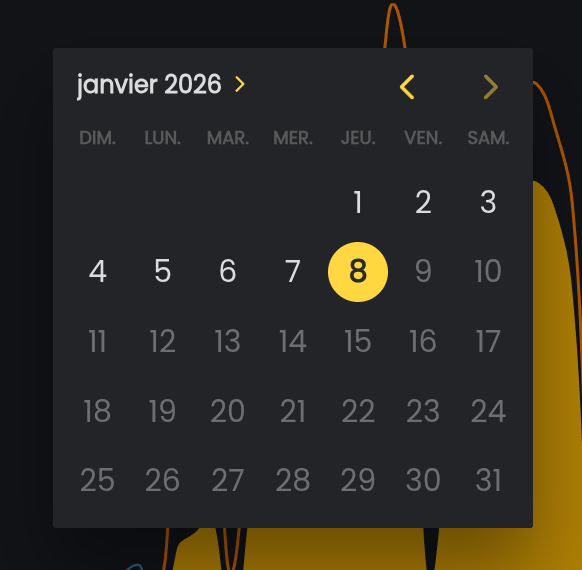
You can change the day, month or year to view previous data. Clicking on the date opens a calendar that lets you choose a specific date more precisely.
Options
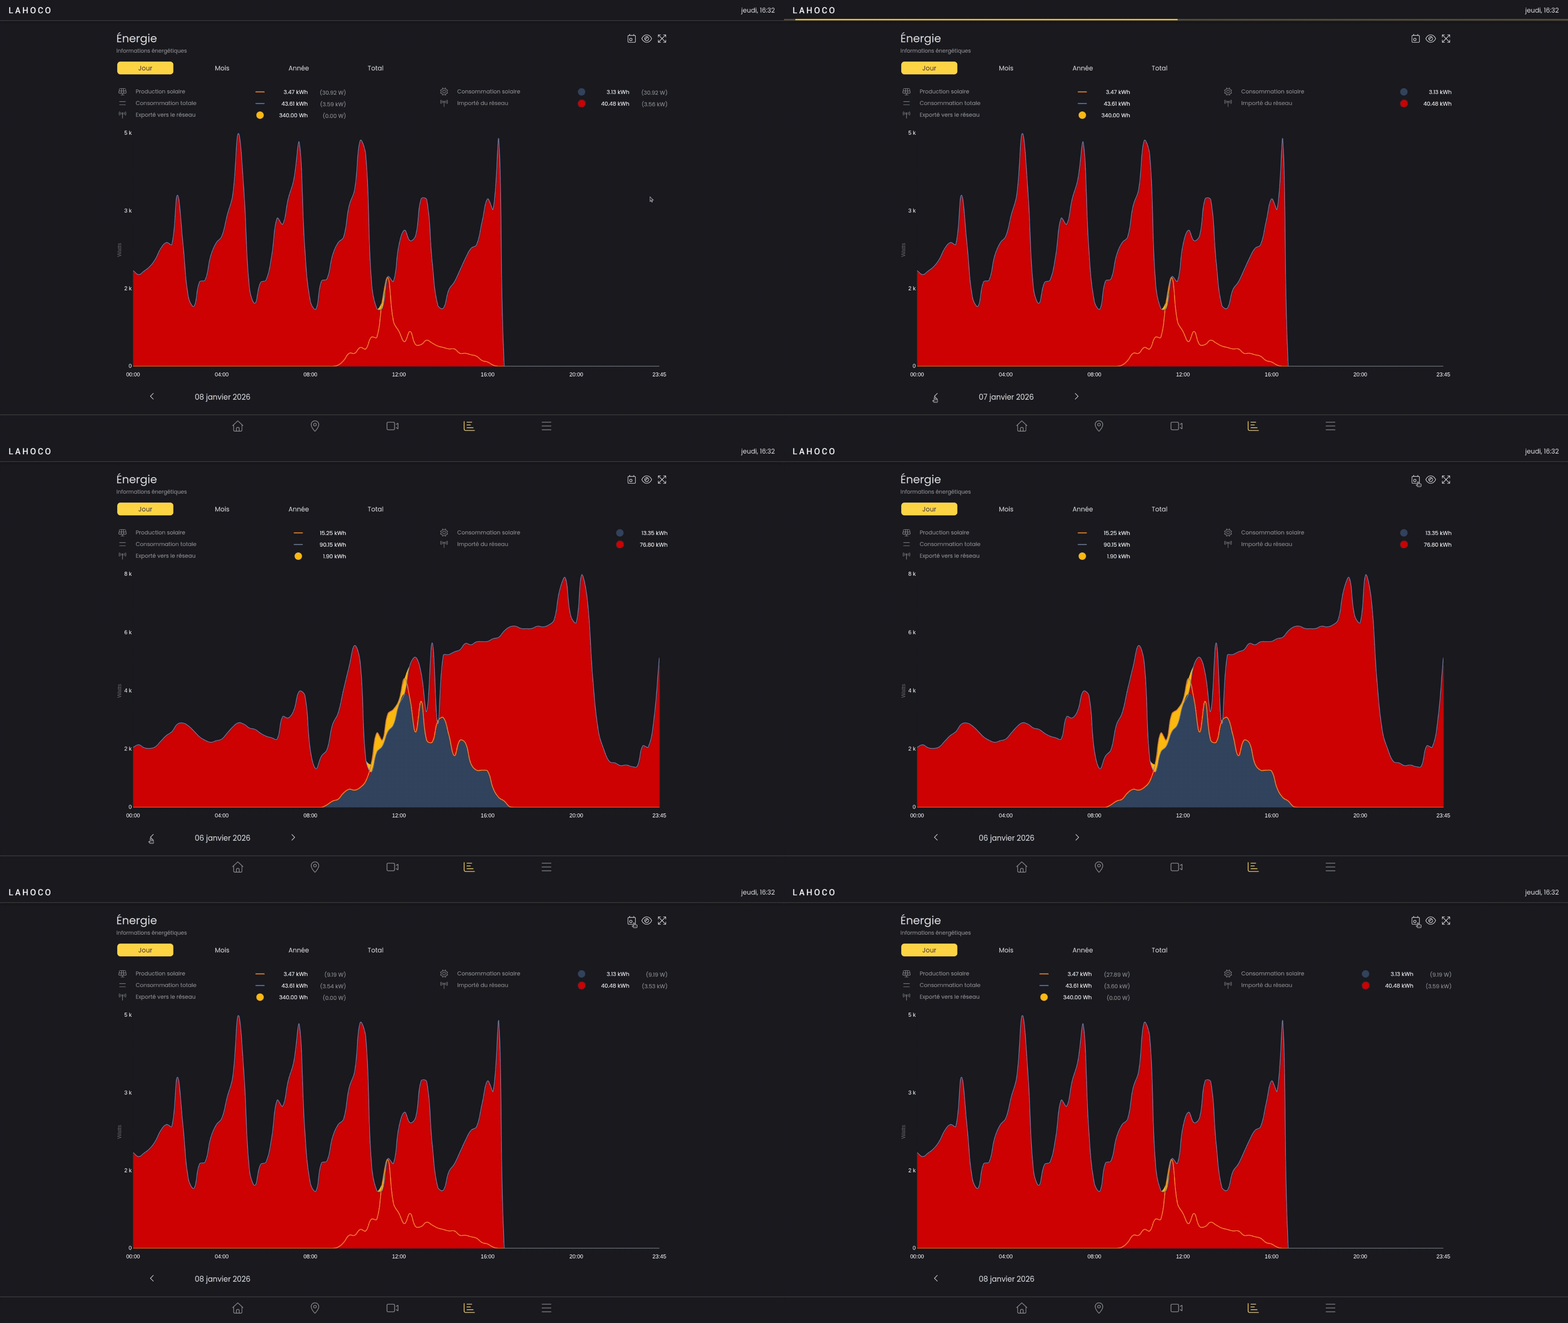
On the “Day”, “Month” and “Year” charts, you can quickly return to today’s date using the calendar-shaped button at the very top right.
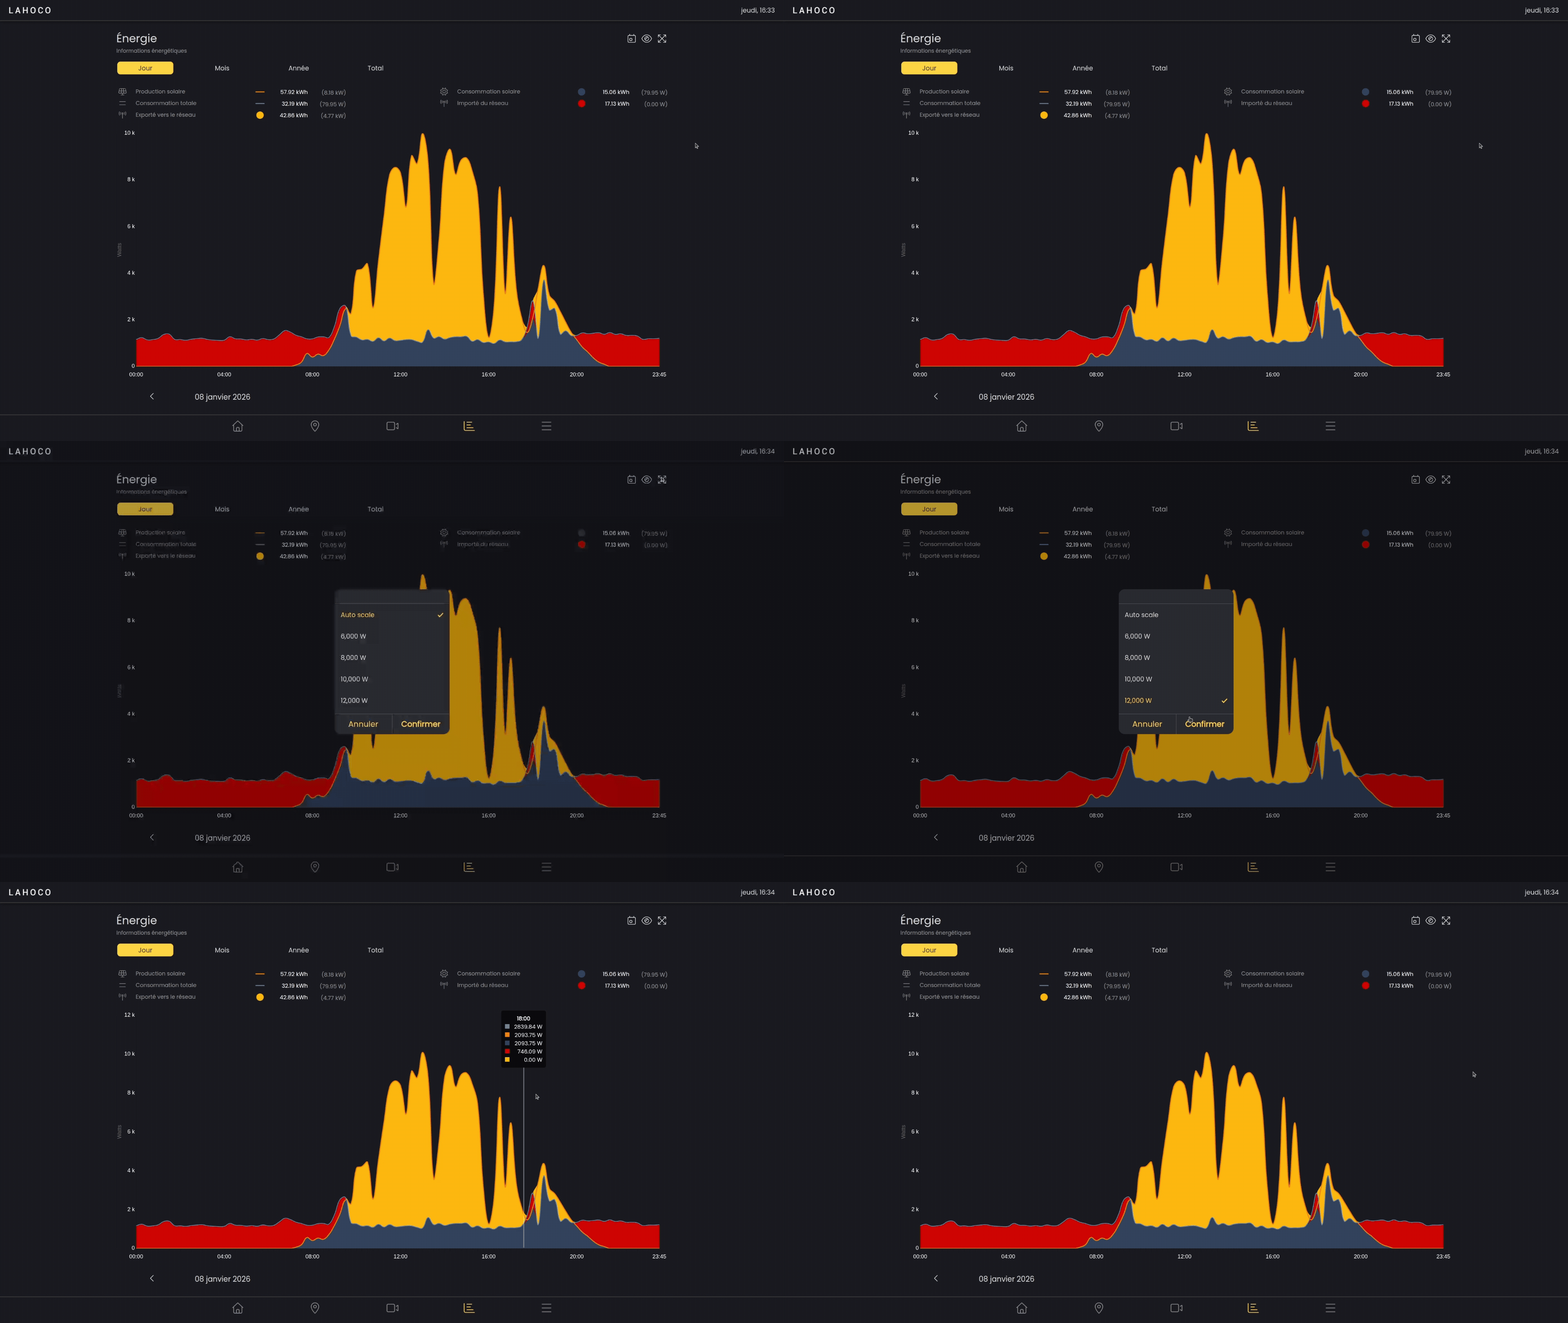
You can also change the chart's scale by clicking on the square icon at the very top right, then choosing the desired maximum value for the chart's height.
You can also view the details of each consumption meter.